But it is the best I can do for the moment!
It talks about the Arduserver at http:/mon277rr.dyndns.org (NO HTTPS available, sorry.) AND about a program which will "watch" that, a "Far Watch Watcher"... fww009. It does at least offer the following pretty picture.
277rr-fww009.htm, vers 3 Jan 25
fww009 interp.txt
vers 01 Jan 2025 started 01 Jan 2025
The Arduserver serves up a line something like the top line here...
5226+1504528+17714230000133
hhhhsttthhhhstttbcccccnnnnn
The second line ("hhhstt...") will help us interpret that line.
The Arduserver has two modules, each of which reports one relative humidity, one temperature
In the example above,
5526 is the first humidity... standing for 55.26%
+150 is the first temperature... standing for 15.0 deg Celcius
4528 is the second humidity
+177 is the second tture (17.7 deg C)
Above the "b" there's a 1. It might be 0, another time. It is the state of an on/off switch, when there is one connected to the Ardusrver. At mon277, 1 Jan 25, there is nothing connected to that input to the Arduserver, and the "b" datum will always be 0.
There is more about these 4 readings further down the page.
Above the ccccc is "just a number". It is a count of something... the times the Arduserver has gone through it's main loop, as I recall. A.N.Y.W.A.Y. the number should just rise and rise until it reaches a limit, and then go back to zero, and resume rising, rising.
When the number above cccc is doing that, there's a pretty good chance that the Arduserver is working as it should... and that you're managing to fetch current data from it. I call it the "proof of life" datum.
Above the nnnnn is a number that sometimes remains unchanging, and at other times rises by one roughly once every two seconds.
------
Going back to the four data at the start of the data string...
The first temperature/humidity pair gives you the circumstance just inside a closet.
The second temperature/humidity pair gives you the circumstance outside a closet.
(Until late December 2024, the sensors were deployed the other way around.)
The nnnnn datum will tell you if the door of the closet is open... which would be unusual. When the door is open, the two sets of data will, of course, tend towards each other.
Inside the closet there is a electric heater which comes on in the low 50's (F), and switches off once the closet warms a bit.
Also inside the closet is a dehumidifier. When it comes on, it warms the air in the closet. This, even before any water is removed from the air, reduces the relative humidity... and the dehumidifier switches off again. (Hopefully SOME water has been extracted!) This can lead to the closet being warmer than I would like, and "unnecessary" "thrashing" of the dehumidifier. But none of that is the Arduserver's fault. At least I know the problem exists.
====
So... that's what the Arduserver reports.
fww009 is a Windows program which reads the Arduserver regularly, saves the data to a log, and draws graphs of it.
A sample of the data it can produce is provided with this.
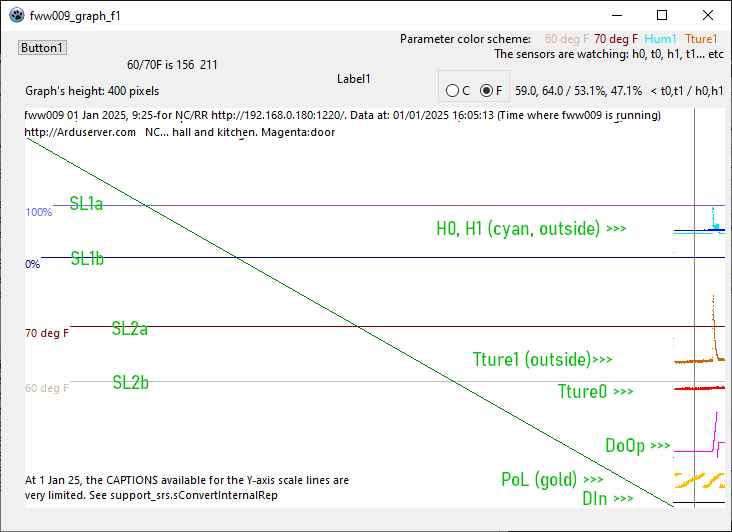
The graph "grows" from the right hand edge of the image. Every so often, the graph is "pushed left".
At midnight, a vertical magenta line is drawn. (There isn't one in the sample.) At 0600, noon, and 1800, vertical gray lines are drawn... you can see one in the sample. The text near the top of the graph tells us that the screenshot was taken not long after 16:45, so the gray line we see was the line to mark noon, and we have four hours an 45 minutes of data since that noon.
___
The green diagonal line...
Everything in the part of the graph that the green diagonal crosses happened before the current starting of fww009.
If fww009 had been run for hours/ days before the time it was started to prepare this sample for you, there would be data in that part of the graph as well. (It is reloaded from the data log that fww009 builds. Unfortunately, no data log was available at the time this sample was collected.
____
fww009 had not been running very long when the sample was captured, but all what it reports is there for study...
____
There are two pairs horizontal lines. (SL1a, SL1b, SL2a, SL2b). These ore "the scale lines".They show you the scale of the graphs in the Y dimension.
At the left of the scale lines are legends which tell you what the lines indicate.
The top two lines show where the graph line would be if a humidity were 0 or 100 percent.
The wiggly blue lines (H0, H1) between the 0 and 100 percent scale lines indicate that the two humidities were generally around 50%.
The spike in the cyan (light blue) line arose when I put a wad of cloth soaked in hot water near the outside-the-closet sensor. The cyan line is a plot of the second humidity reported in the data string.
The wiggly rust-color and red lines (Tture0, Tture1) between the 60 deg F and 70 Deg F scale lines indicate that the two temperatures were generally around...
64 Deg F outside the closet,
59 deg F inside the closet.
The spike in the rust-colored line arose when I put a wad of cloth soaked in hot water near the outside-the-closet sensor. The rust-colored line is a plot of the second temperature reported in the data string.
The temperature line shows most clearly how the value lept up when I put the hot water near it, and then cooled quickly at first and then ever more slowly as the water temperature approached the ambient temperature.
____
The magenta (red/pink) line (DoOp) tells us whether the door was open. When the line is horizontal, the door is closed. If it is rising, the door is open. It is constricted to just a portion of the height of the whole graph. In the sample you can see the door was open for quite a long time, during which the value plotted was "wrapped" once. The Y-value for any particular moment.
_______
The "gold" diagonal slashes arise from the "proof of life" datum. (PoL)
Depending on scaling and offset choices made by the ini file, you sometimes get this nice wrapped rising line... but not always. As long as the gold line isn't a flat horizontal line, you can assume that the Arduserver is working, and that fww009 is successfully reading it.
________
The rather dull black line (DIn, fo r Digital INput) at the bottom of the screen plots the value returned by the "b" datum in the data string. As I said, the Arduserver at mon277, 1 Jan 25, was always returning 0 at the time this sample was generated.
________
Just to the right of the C and F radio buttons (they make fww009 report in Celcius or Fahrenheit) in the sample, you'll see...
59.2%, 63.9 / 53.2%, 47.0%
These are the two temperatures and the two humidities reported most recently. The first one in each pair comes from the first part of the data string. I.e., since late December 2024, the temperature and relative humidity OUTSIDE the closet.
(If you change which radio button is "pushed down", there my be a slight lag before the information on the screen changes. (No more than 2 seconds.)